Cyber-Physical Systems with OPAIRS®: Connecting Machines and Sensors On-Premise
So far, OPAIRS has learned from ERP systems, documents and databases. With OPAIRS Connect Machine, the machines themselves join in: controllers, sensors and equipment deliver their values via OPC UA, Siemens S7, Beckhoff TwinCAT, Modbus, EtherNet/IP or IO-Link into a local database that the OPAIRS® Dashboard and AI agents read from. Everything runs in-house, without the cloud and without a connection to external services.
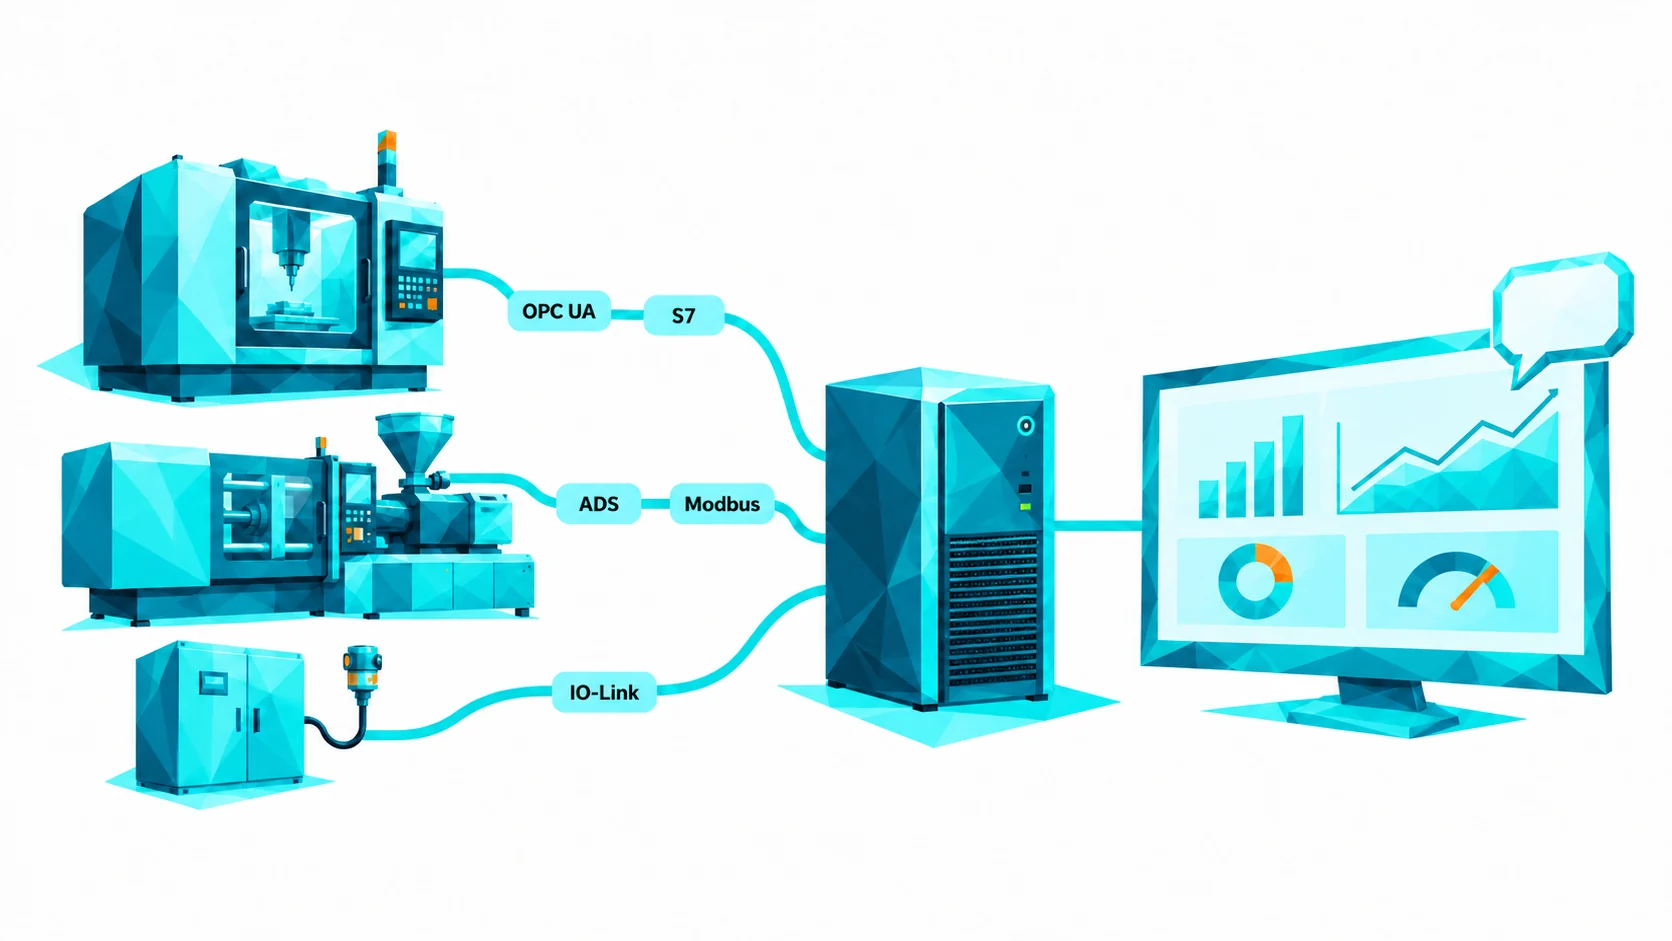
An AI that only knows documents and business data sees the shop floor from the outside. What happens at the machine – temperature curves, cycle times, downtimes, test results – sits in controllers and sensors and is often not stored permanently at all. Cyber-physical systems close this gap: the physical equipment delivers data, software analyses it, and people make decisions on that basis.
OPAIRS therefore extends the platform to the machine level. The OPAIRS Connect Machine module reads machine and sensor data from production and writes it to a PostgreSQL database. The OPAIRS® Dashboard and the OPAIRS AI platform read from there. Everything runs on-premise in Docker, without cloud services. An important caveat: data flows in one direction, from the machine into the platform. The module only reads; it does not write anything back to controllers. Today the data lands in PostgreSQL; the integration into the OPAIRS® Datalake is under way and is expected to be completed by Q3/2027.
Machines at Different Levels
A shop floor is rarely uniform. Alongside new equipment with its own OPC UA server there are older controllers, energy meters on Modbus and individual sensors. The module is built on benthos-umh, an industrial distribution of Benthos and Redpanda Connect, and thereby covers several levels:
- Sensor level: ifm IO-Link masters (for example AL1350 and AL1352). Connected sensors are automatically broken down into named measurements using their device description (IODD), such as port1.Temperature. IO-Link sensors connected via Bluetooth mesh through the EIO404 base station are also supported.
- Controller level: Siemens S7 (S7-300/400/1200/1500), Beckhoff TwinCAT 2/3 via ADS (by symbol name; the connector is still listed as experimental in its documentation), Modbus TCP for meters, drives and simple PLCs, and EtherNet/IP for Rockwell ControlLogix, CompactLogix and Micro820.
- Machine level: OPC UA as the standard route for modern machines, with source timestamp and quality status per value.
- Gateway and supervisory level: Sparkplug B over MQTT as well as MQTT, HTTP, SQL and files, for example for MES, databases or CSV exports.
Not directly connectable are Fanuc FOCAS, Heidenhain DNC, Mitsubishi MC and Omron FINS. For these, the route is via an OPC UA server on the machine or via a gateway. ERP connections are not part of this module; they run through the platform’s other data paths.
Four Services, One Data Path
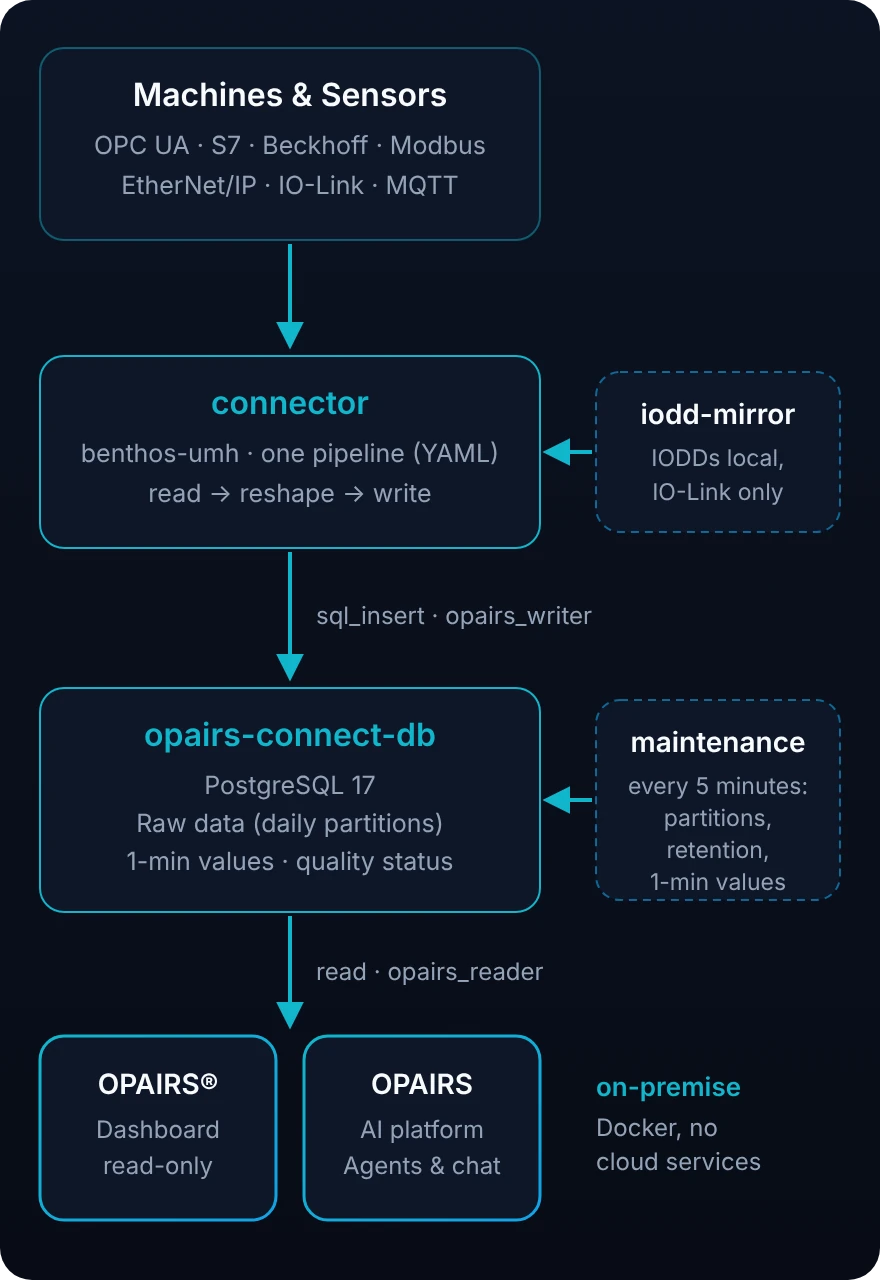
From Sensor to Database
The connector runs one pipeline: read the source, reshape it into the database’s row format and write it to PostgreSQL with a write-only user. A pipeline is a YAML file; new or changed pipelines need no new build. The database runs as its own service, and a maintenance service creates partitions every five minutes, cleans up after the retention period and calculates one-minute values. The IODD mirror is only added for IO-Link. The OPAIRS® Dashboard and the AI platform read with a separate read-only user.
Quality Instead of Noise: Raw Data, One-Minute Values and Quality Status
Every measurement is stored with timestamp, machine, signal name, value and quality indicator in the raw data table, which is partitioned daily. One-minute values with mean, minimum, maximum and sample count are derived from it. By default, raw data is kept for 30 days and one-minute values for 400 days; both periods are configurable.
The quality indicator comes from the source: OPC UA reports Good, Uncertain or Bad for each value. Only good values flow into the one-minute values; the rest are counted in a separate column. This way, disturbances do not distort the averages but remain visible. For sources without a quality indicator, such as Modbus and S7, the field stays empty and the values count as good.
The database is plain PostgreSQL without extensions. Compression and continuous aggregates from TimescaleDB are deliberately not used, because these community features are not under an open-source licence but under the vendor’s own licence (Timescale License, now Tiger Data License). The price is clear: raw data is kept for a short time, one-minute values for a long time. Values with a timestamp in the future, for example due to a wrong clock at the source, are stored but not aggregated.
IO-Link Without Internet Access
IO-Link sensors describe themselves through a device description, the IODD. By default, the plugin downloads it over the internet from a mirror of the IODDfinder. The iodd-mirror service answers exactly these requests itself and serves the IODDs from a local folder, as ZIP or XML. New files are active after one minute at most, and no restart is needed. If an IODD is missing for a sensor, the connector switches to raw data and keeps running. This allows IO-Link to be operated even in plants without internet access, and sensors are still detected automatically.
From the Machine to the OPAIRS® Dashboard
The OPAIRS® Dashboard reads with a read-only user that must not write anything. The module ships with a ready-made, importable dashboard “OPAIRS Connect” with five tabs: Overview, CNC, Injection Moulding, Assembly and Raw Data. Time range (default: last week) and machine can be filtered at the top; the dashboard refreshes every minute.
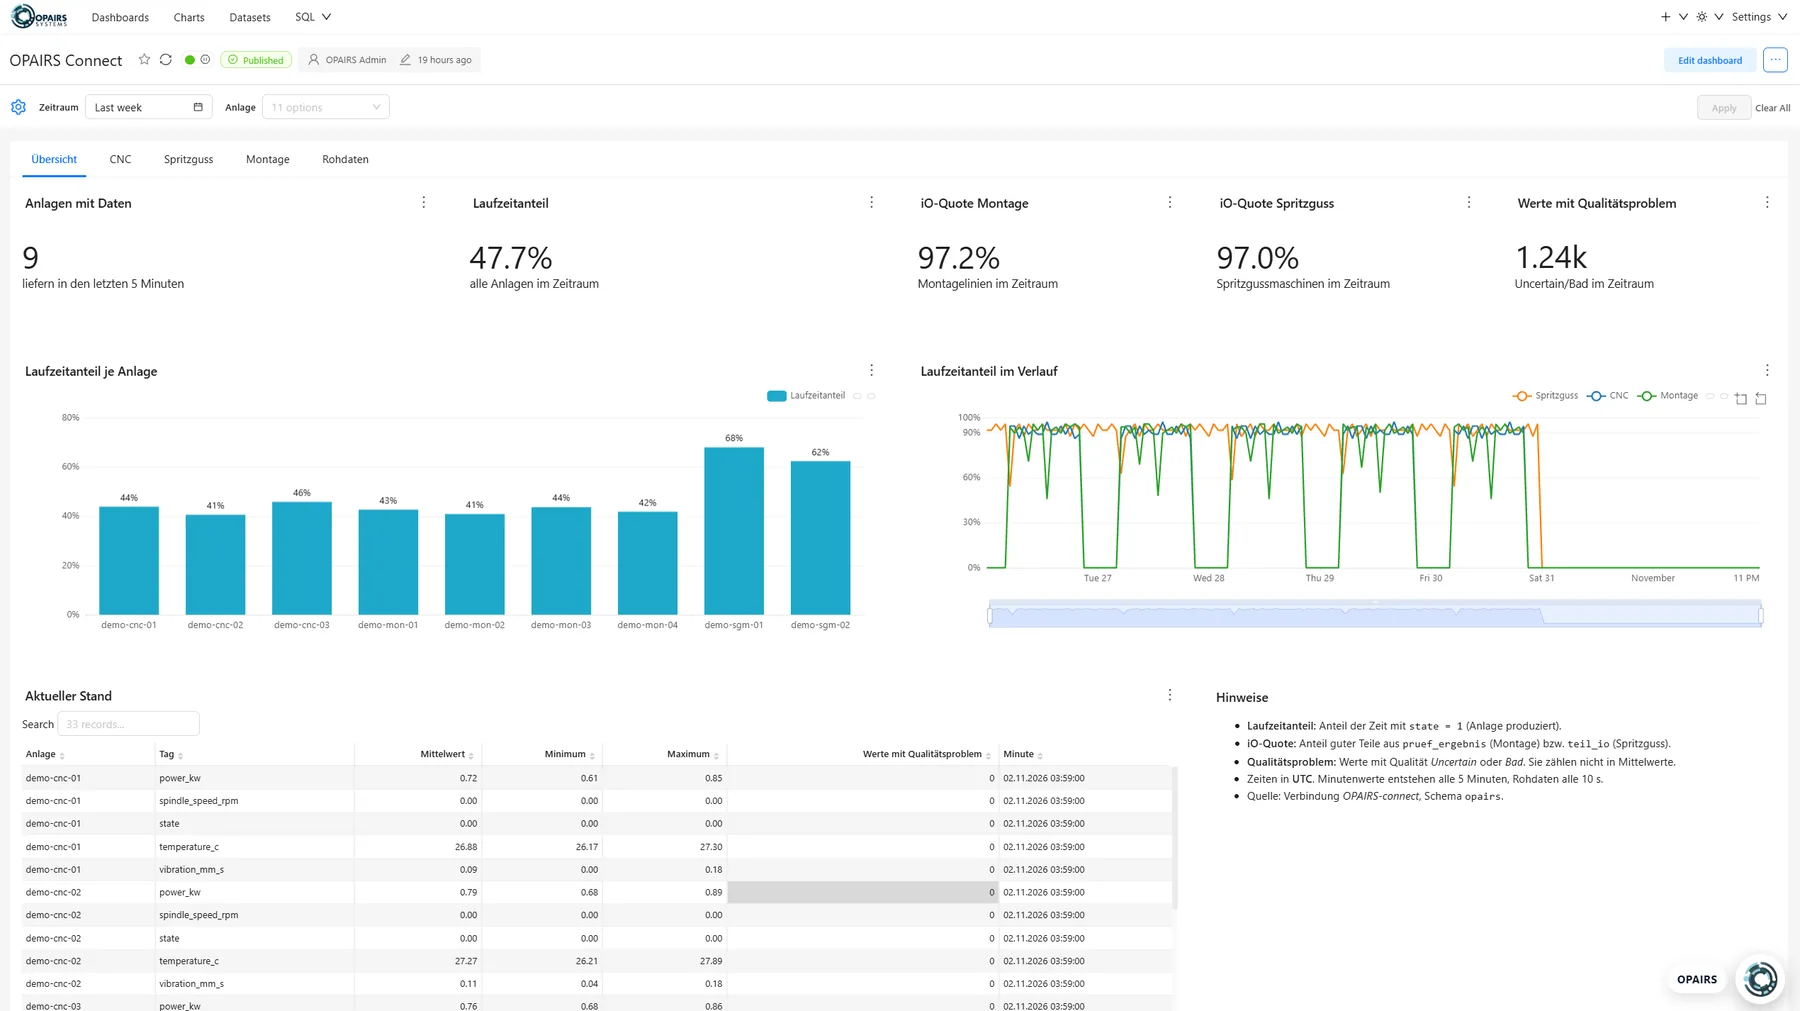
Overview: Uptime, OK Rate and Quality Problems
The overview summarises the state of production: machines with data, uptime share, OK rate in assembly and injection moulding, and the number of values with quality problems. In addition there are the uptime share per machine and over time per area, and a table with the current state of every machine.
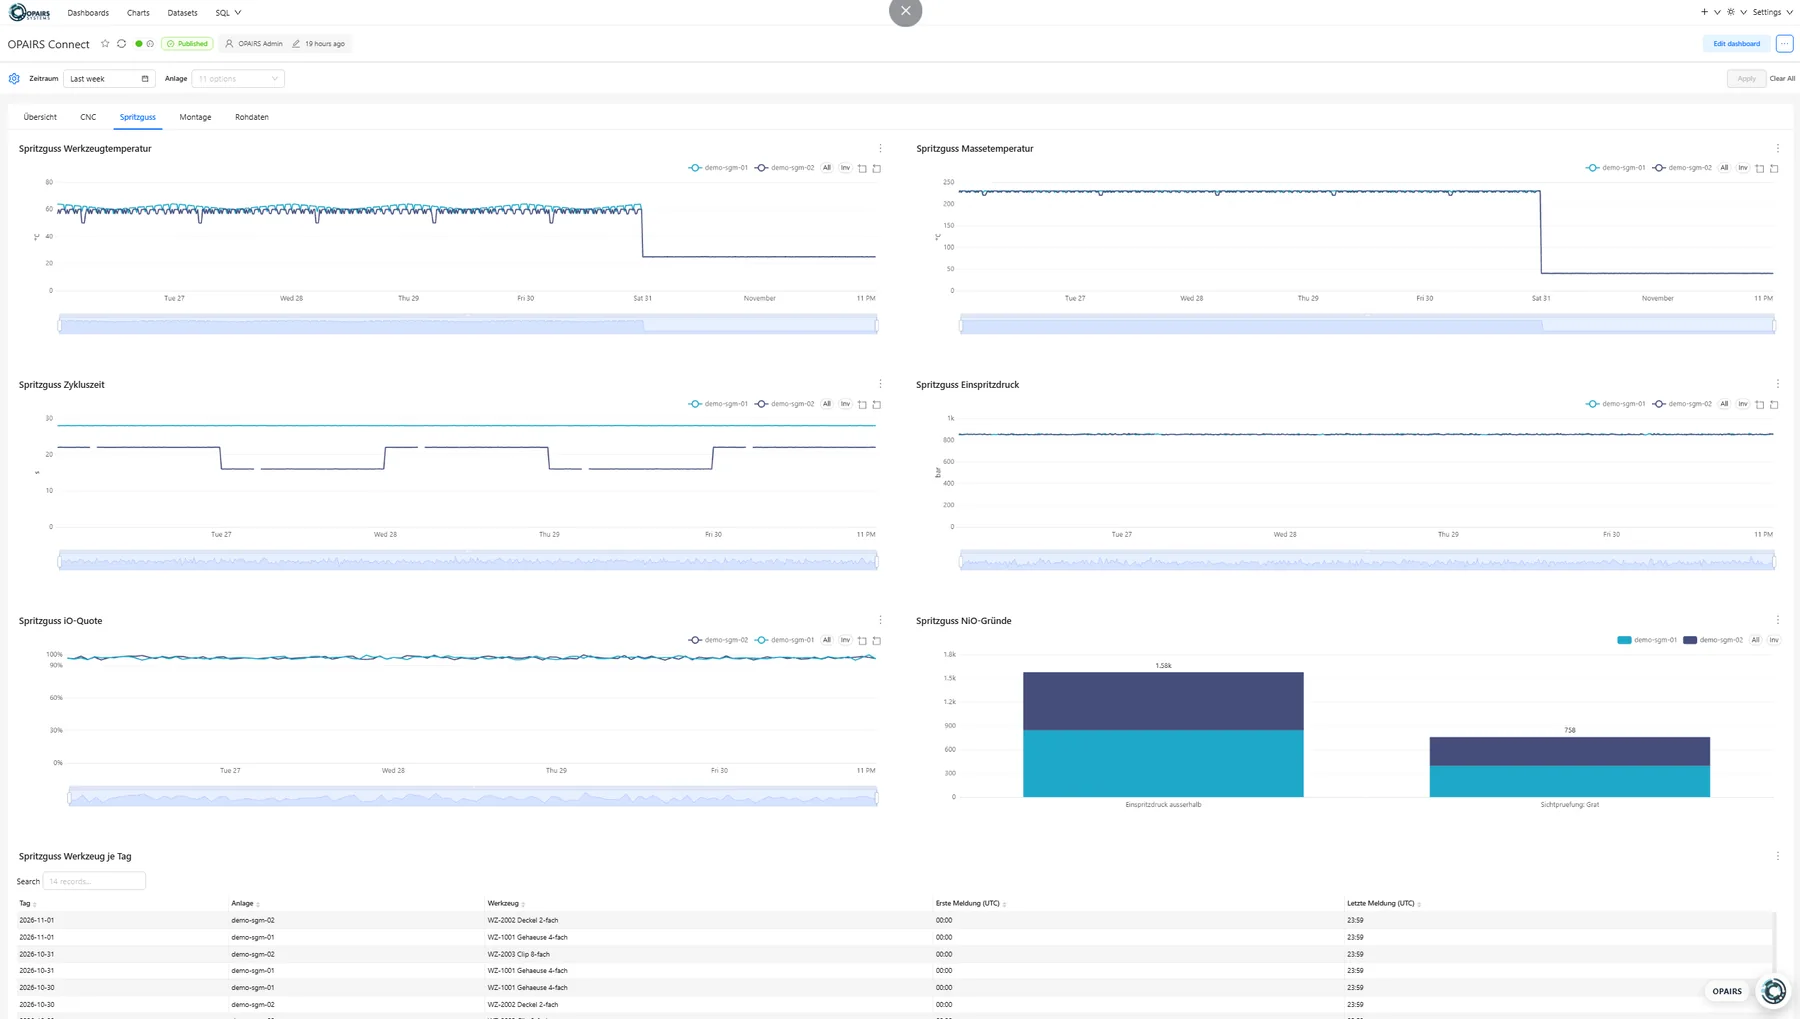
Specialist Tabs: CNC, Injection Moulding and Assembly
Each area shows the quantities that matter there: for CNC spindle speed, temperature, power and vibration; in injection moulding mould and melt temperature, cycle time, injection pressure and the reasons for rejected parts; in assembly screwing torque, leak rate, press-in force, insulation resistance and the OK rate per line.
The Agent in the Dashboard
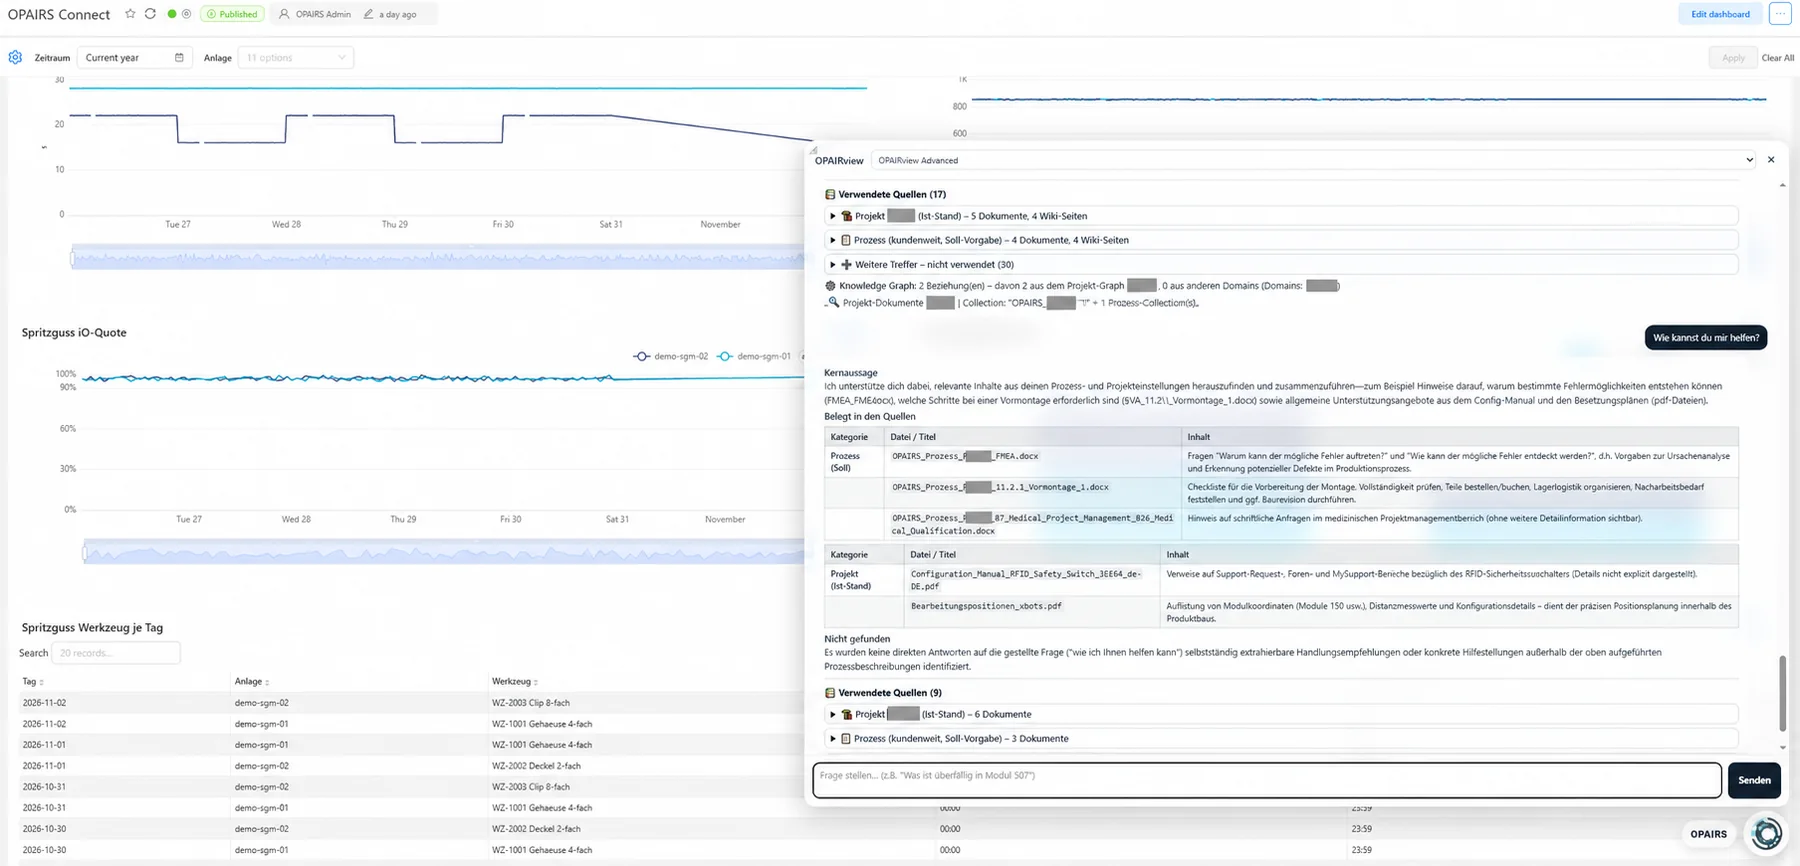
Through a chat window at the edge of the dashboard, the OPAIRview agent answers questions about the platform’s data, directly in the OPAIRS® Dashboard and without switching to another tool. The answer is structured: a key statement, evidence from the sources used, such as documents, wiki pages and knowledge graph, and an explicit note on what was not found.
For dashboards without a real machine, the module ships with a demo: nine simulated machines (three CNC machines, two injection moulding machines and four assembly stations) with shift operation, faults and OK/NOK tests, optionally with seven days of history. This makes it possible to show and check the entire path up to the dashboard before the first real machine is connected.
PostgreSQL Today, OPAIRS® Datalake Tomorrow
Today the connector writes the machine data into its own PostgreSQL database. The OPAIRS® Dashboard and the AI platform read from there. In parallel, the integration into the OPAIRS® Datalake, where the platform’s other data sources come together, is under way. According to current planning, it is expected to be completed in the third quarter of 2027.
A schedule is no substitute for testing: the integration continuously requires tests with real machine data. Simulators and demo machines show that the data path works technically, but not how real controllers, faults and signal names behave.
Data Sovereignty All the Way to the Machine
- By default, no port is open to the outside. Releases are made only selectively and internally.
- Separate roles: the connector may only write, the dashboard may only read.
- The connector needs network access to the machines but no internet. Only the first build needs internet access; for customer environments without internet, the finished images are transferred.
- There is no connection to UMH’s servers and there are no cloud services.
This extends the platform’s principle that data stays in-house to the machine level. Machine data in particular reveals a lot about utilisation, scrap and cycle times.
From Measurement to Forecast
Machine data are time series, and time series are the raw material for forecasts. The one-minute values with mean, minimum, maximum and quality status sit in PostgreSQL, one of the source systems the OPAIRS SQL agent opens up. This gives rise to the chain we described in the post on the forecasting service: the SQL agent fetches the series, the forecasting service calculates forecast and backtest, and the result comes back into the chat with model choice, quality and warnings: https://opairs-systems.com/en/insights/opairs-forecasting-zeitreihenprognose-on-premise
The forecasting service bundles statistical models (ETS, Theta, ARIMA) and the foundation models Chronos-Bolt and TiRex-2 behind one endpoint and runs entirely locally on the server’s CPU, leaving the GPUs free for the language models. A backtest against a simple baseline decides which model is used. If no model beats this baseline, the service still delivers the forecast but explicitly marks it as not validated. This is especially valuable for noisy machine series: a service that discloses when it should not be trusted protects against false certainty.
Questions this allows you to ask of machine data:
- How will a machine’s energy demand develop over the next few days, and when will load peaks occur?
- How does a quantity that drifts over the shift behave, for example a rising screwing torque due to wear, and when would a limit be reached?
- How will the uptime share or utilisation of a line change over the coming weeks?
To put this in context: this is the intended path, not a finished integration. The forecasting service has so far been tested on public time series; testing with real production time series is still to come. The forecasting service is open source under Apache-2.0: https://github.com/OPAIRS/opairs-forecast
Acknowledgements
The protocol connectivity is provided by benthos-umh from UMH Systems GmbH (Apache-2.0, https://github.com/united-manufacturing-hub/benthos-umh). Only the connectors were adopted, not Kubernetes, the management console, the embedded Redpanda or TimescaleDB. Further components are Redpanda Connect, PostgreSQL, the IODDfinder of the IO-Link Community as the source of device descriptions, and Microsoft OPC PLC (https://github.com/Azure-Samples/iot-edge-opc-plc) as a test server. The licences and terms of use, in particular for the IODD files from device manufacturers, should be checked before use.
Part of the OPAIRS Platform
On the OPAIRS platform, Connect Machine adds the machine level to the existing data paths for ERP, documents and databases. With it, the pipeline we described in “Industrial AI Pipeline: From Data to AI Recommendation” gains another source: https://opairs-systems.com/en/insights/opairs-pipeline-von-daten-zu-entscheidungen
Wanted: Real Machine Data from Manufacturing
Simulators and demo machines show that the data path works. Whether it holds up in daily operation can only be shown by real equipment. For the integration into the OPAIRS® Datalake and for forecasts on machine data, OPAIRS is therefore looking for partners who want to test the path on their own controllers and sensors: via OPC UA, Siemens S7, Beckhoff TwinCAT, Modbus or IO-Link, and for forecasts ideally with at least two years of history per machine. The data stays in-house or under the partner’s control.
For technical collaboration, joint validation or industrial projects: office@opairs-systems.com
More insights
OPAIRS SBOM Scanner: Continuous Vulnerability and Supply-Chain Monitoring for the Cyber Resilience Act
Since 11 September 2026, manufacturers must report actively exploited vulnerabilities in their products within 24 hours – from December 2027 the Cyber Resilience Act applies in full, including a software bill of materials. To report, you first need to know what is inside your own software. OPAIRS built a scanner for that: it runs entirely on-premise, watches continuously and only raises the alarm when it matters.
Read article
OPAIRS Forecasting: Self-Hosted Time-Series Forecasting for Manufacturing
How much material will we consume next quarter, when will energy demand rise, which items will run out? Time-series forecasts answer questions like these – usually through cloud services that production data has to be sent to. OPAIRS has built its own forecasting service that runs entirely on-premise, recommends a model only when it demonstrably beats a simple baseline, and connects with the SQL Agent into one continuous chain: query the data, forecast, evaluate.
Read article